\( \DeclareMathOperator{\abs}{abs} \newcommand{\ensuremath}[1]{\mbox{$#1$}} \)
Lab sheet 4
1 Parametric plotting
| --> | wxplot2d ( [ parametric , cos ( 10 · t ) / ( 1 + t ^ 2 ) , sin ( 10 · t ) / ( 1 + t ^ 2 ) , [ t , − 5 , 5 ] ] , [ same_xy ] ) ; |
\[\operatorname{ }\]
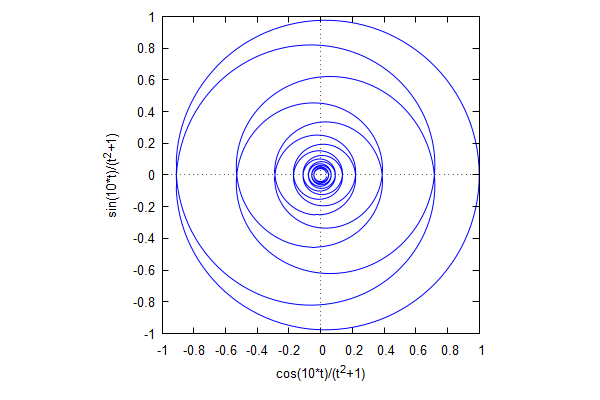
\[\operatorname{ }\]
| --> | wxplot2d ( [ parametric , sin ( 3 · t ) , sin ( 2 · t ) , [ t , 0 , 2 · %pi ] ] , [ same_xy ] , [ box , false ] , [ axes , false ] ) ; |
\[\operatorname{ }\]
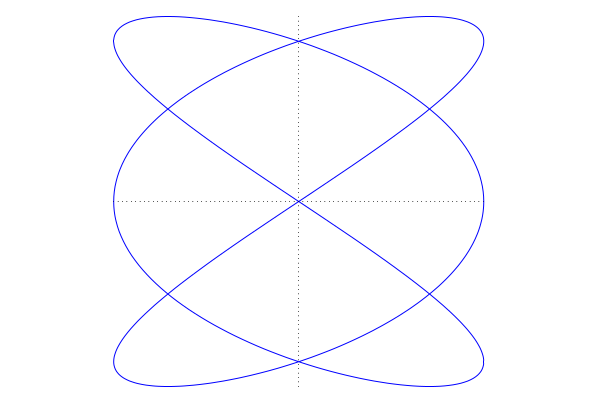
\[\operatorname{ }\]
| --> |
wxdraw
(
gr2d
(
nticks = 100 , proportional_axes = ' xy , xtics = false , ytics = false , axis_top = false , axis_bottom = false , axis_left = false , axis_right = false , color = red , parametric ( sin ( 3 · t ) , sin ( 2 · t ) , t , 0 , 2 · %pi ) ) ) ; |
\[\operatorname{ }\]
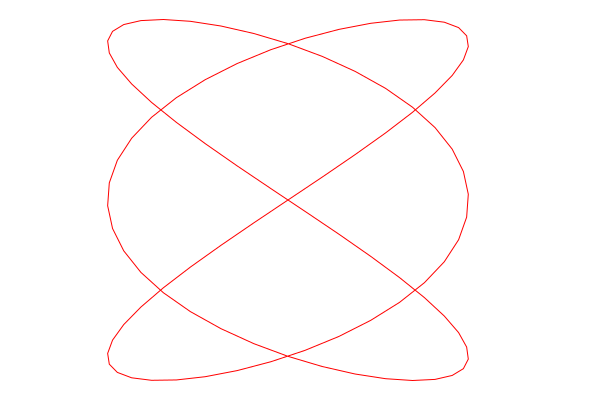
\[\operatorname{ }\]
| --> | wxplot2d ( [ parametric , t − sin ( t ) , 1 − cos ( t ) , [ t , 0 , 8 · %pi ] ] , [ same_xy ] , [ box , false ] , [ axes , false ] ) ; |
\[\operatorname{ }\]
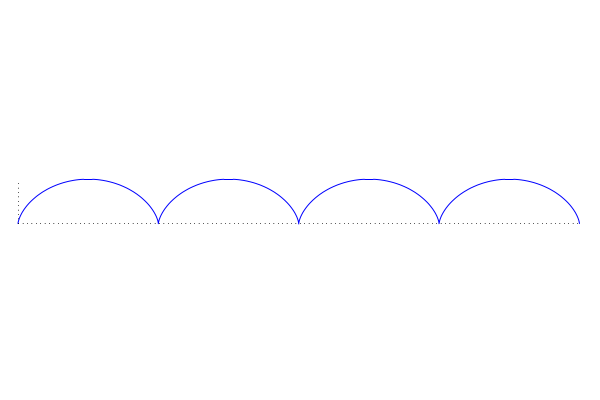
\[\operatorname{ }\]
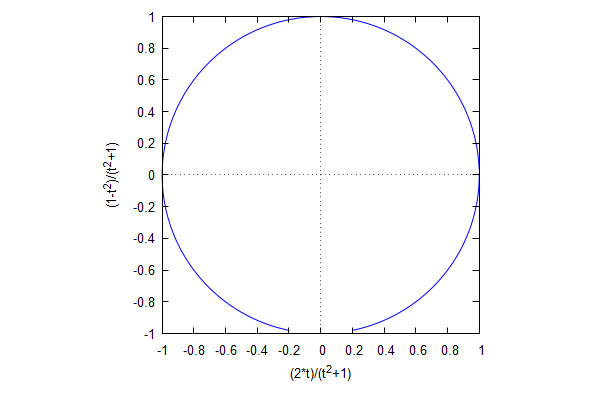
| --> | wxplot2d ( [ parametric , 2 · t / ( 1 + t ^ 2 ) , ( 1 − t ^ 2 ) / ( 1 + t ^ 2 ) , [ t , − 10 , 10 ] ] , [ same_xy ] ) ; |
\[\operatorname{ }\]
\[\operatorname{ }\]
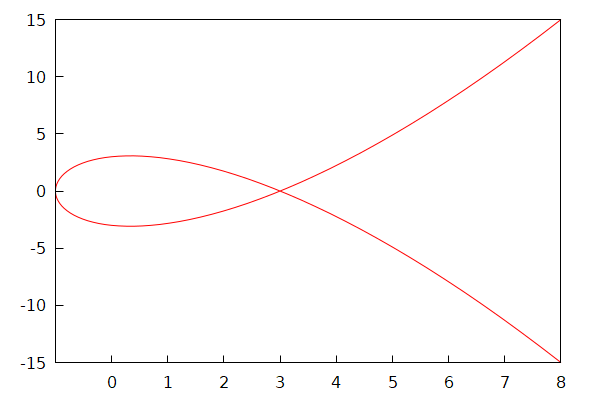
| --> | x : 4 · t ^ 2 − 1 ; y : 8 · t ^ 3 − 8 · t ; |
\[\operatorname{(x) }4 {{t}^{2}}-1\]
\[\operatorname{(y) }8 {{t}^{3}}-8 t\]
| --> |
pic1
:
[
color
=
red
,
nticks
=
100
,
parametric
(
x
,
y
,
t
,
−
1
.
5
,
1
.
5
)
]
$
wxdraw ( apply ( gr2d , pic1 ) ) ; |
\[\operatorname{ }\]
\[\operatorname{ }\]
| --> |
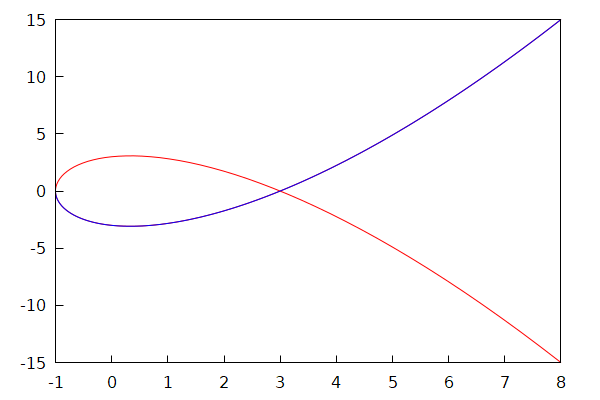
pic2
:
[
color
=
blue
,
explicit
(
(
X
−
3
)
·
sqrt
(
X
+
1
)
,
X
,
−
1
,
8
)
]
$
wxdraw ( apply ( gr2d , append ( pic1 , pic2 ) ) ) ; |
\[\operatorname{ }\]
\[\operatorname{ }\]
| --> | map ( lambda ( [ e ] , subst ( e , [ t , x , y ] ) ) , solve ( y = 0 , t ) ) ; |
\[\operatorname{ }[[-1,3,0],[1,3,0],[0,-1,0]]\]
| --> | kill ( x , y ) $ |
2 Implicit plotting
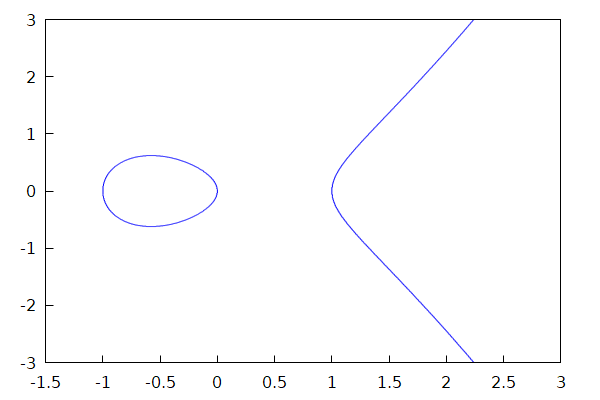
| --> | wxdraw2d ( ip_grid = [ 200 , 200 ] , implicit ( y ^ 2 = x ^ 3 − x , x , − 1 . 5 , 3 , y , − 3 , 3 ) ) ; |
\[\operatorname{ }\]
\[\operatorname{ }\]
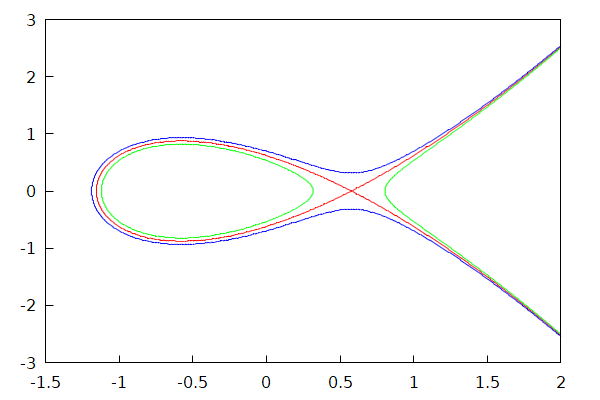
| --> | a0 : 2 / 3 ^ ( 3 / 2 ) , float ; |
\[\operatorname{(a0) }0.3849001794597506\]
| --> |
wxdraw
(
gr2d
(
ip_grid = [ 100 , 100 ] , color = red , implicit ( y ^ 2 = x ^ 3 − x + a0 , x , − 1 . 5 , 2 , y , − 3 , 3 ) , color = blue , implicit ( y ^ 2 = x ^ 3 − x + a0 + 0 . 1 , x , − 1 . 5 , 2 , y , − 3 , 3 ) , color = green , implicit ( y ^ 2 = x ^ 3 − x + a0 − 0 . 1 , x , − 1 . 5 , 2 , y , − 3 , 3 ) ) ) ; |
\[\]\[rat: replaced -0.3849001794597506 by -14326002/37220045 = -0.3849001794597508 \]\[rat: replaced -0.4849001794597506 by -39245734/80935697 = -0.4849001794597506 \]\[rat: replaced -0.2849001794597505 by -4241599/14888018 = -0.2849001794597508\]
\[\operatorname{ }\]
\[\operatorname{ }\]
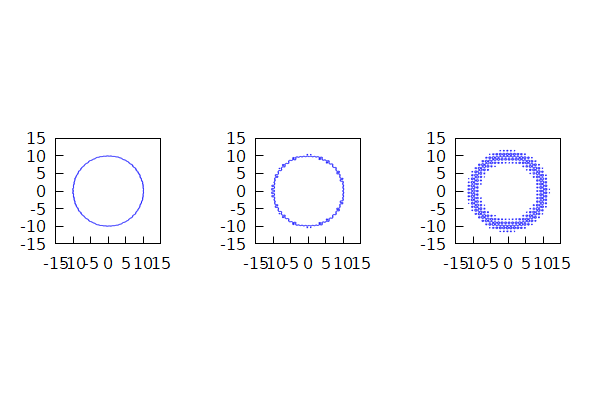
| --> | z : x ^ 2 + y ^ 2 + a · ( sin ( 2 · %pi · x ) + cos ( 2 · %pi · y ) ) ; |
\[\operatorname{(z) }a\, \left( \cos{\left( 2 \ensuremath{\pi} y\right) }+\sin{\left( 2 \ensuremath{\pi} x\right) }\right) +{{y}^{2}}+{{x}^{2}}\]
| --> |
wxdraw
(
gr2d ( ip_grid = [ 200 , 200 ] , proportional_axes = xy , implicit ( subst ( a = 1 , z ) = 100 , x , − 15 , 15 , y , − 15 , 15 ) ) , gr2d ( ip_grid = [ 200 , 200 ] , proportional_axes = xy , implicit ( subst ( a = 5 , z ) = 100 , x , − 15 , 15 , y , − 15 , 15 ) ) , gr2d ( ip_grid = [ 200 , 200 ] , proportional_axes = xy , implicit ( subst ( a = 20 , z ) = 100 , x , − 15 , 15 , y , − 15 , 15 ) ) , columns = 3 ) ; |
\[\operatorname{ }\]
\[\operatorname{ }\]
3 Plotting lists of points
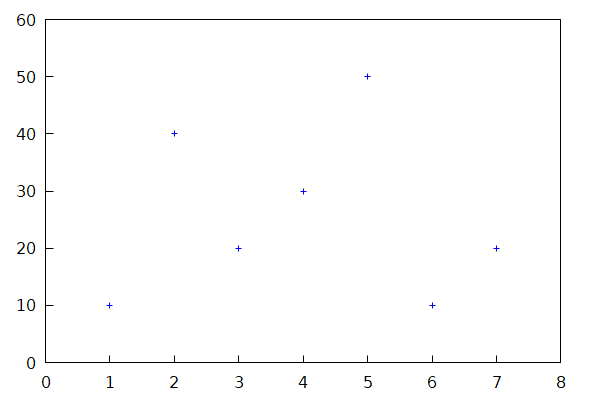
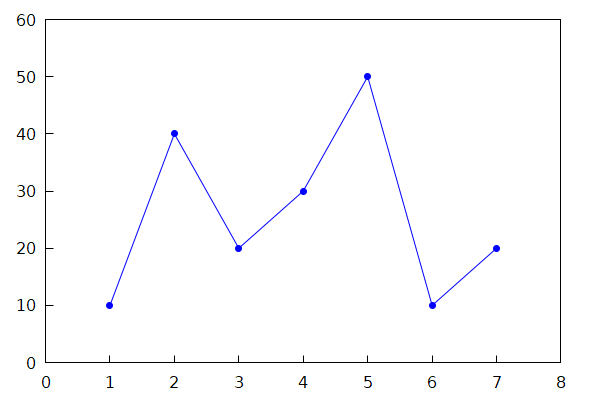
| --> | vals : [ 10 , 40 , 20 , 30 , 50 , 10 , 20 ] ; |
\[\operatorname{(vals) }[10,40,20,30,50,10,20]\]
| --> | makelist ( [ i , vals [ i ] ] , i , 1 , length ( vals ) ) ; |
\[\operatorname{ }[[1,10],[2,40],[3,20],[4,30],[5,50],[6,10],[7,20]]\]
| --> | wxdraw ( gr2d ( xrange = [ 0 , 8 ] , yrange = [ 0 , 60 ] , points ( makelist ( [ i , vals [ i ] ] , i , 1 , length ( vals ) ) ) ) ) ; |
\[\operatorname{ }\]
\[\operatorname{ }\]
| --> |
wxdraw
(
gr2d
(
xrange
=
[
0
,
8
]
,
yrange
=
[
0
,
60
]
,
points_joined
=
true
,
point_type
=
filled_circle
,
points ( makelist ( [ i , vals [ i ] ] , i , 1 , length ( vals ) ) ) ) ) ; |
\[\operatorname{ }\]
\[\operatorname{ }\]
| --> | N : 1000 $ |
| --> |
primes
:
[
2
]
$
for
i
from
2
thru
N
do
(
primes
:
cons
(
next_prime
(
primes
[
1
]
)
,
primes
)
)
$
primes : reverse ( primes ) $ |
| --> |
wxdraw
(
gr2d
(
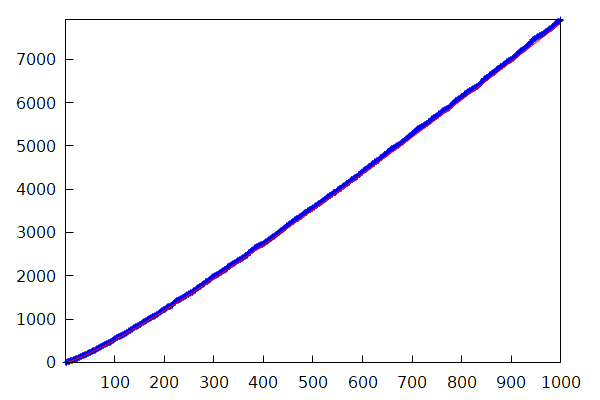
points ( makelist ( [ i , primes [ i ] ] , i , 1 , N ) ) , color = red , explicit ( x · ( log ( log ( x ) ) + log ( x ) − 1 ) , x , 1 , N ) ) ) ; |
\[\operatorname{ }\]
\[\operatorname{ }\]
| --> | kill ( N ) $ |
| --> | 20 ! ; |
\[\operatorname{ }2432902008176640000\]
| --> | 1 . 0 · 20 ! ; |
\[\operatorname{ }2.43290200817664 {{10}^{18}}\]
| --> | f ( x ) : = sqrt ( 2 · %pi ) · x ^ ( x + 1 / 2 ) · exp ( − x ) ; |
\[\operatorname{ }\operatorname{f}(x):=\sqrt{2 \ensuremath{\pi} } {{x}^{x+\frac{1}{2}}} \operatorname{exp}\left( -x\right) \]
| --> |
wxdraw
(
gr2d
(
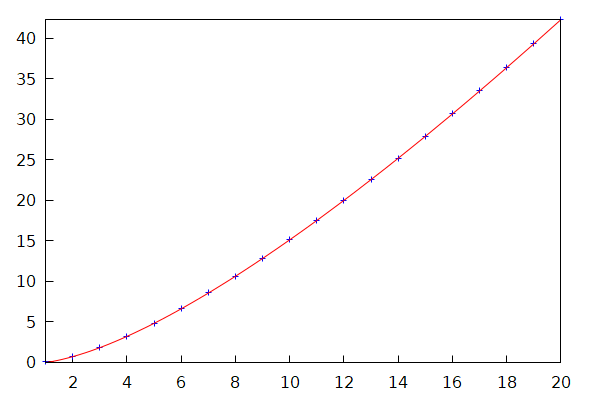
points ( makelist ( [ i , log ( i ! ) ] , i , 1 , 20 ) ) , color = red , explicit ( log ( f ( x ) ) , x , 1 , 20 ) ) ) ; |
\[\operatorname{ }\]
\[\operatorname{ }\]
| --> | kill ( f ) $ |
| --> | q ( c , x ) : = c · x · ( 1 − x ) ; |
\[\operatorname{ }\operatorname{q}\left( c,x\right) :=c x\, \left( 1-x\right) \]
| --> | f ( n , c ) : = block ( [ ] , if n = 0 then return ( 0 . 5 ) else return ( q ( c , f ( n − 1 , c ) ) ) ) ; |
\[\operatorname{ }\operatorname{f}\left( n,c\right) :=\operatorname{block}\left( [],\operatorname{if} n=0 \operatorname{then} \operatorname{return}\left( 0.5\right) \operatorname{else} \operatorname{return}\left( \operatorname{q}\left( c,\operatorname{f}\left( n-1,c\right) \right) \right) \right) \]
| --> |
F
(
n
,
c
)
:
=
block
(
l : [ [ 0 , 0 . 5 ] ] , for i from 1 thru n do ( l : cons ( [ i , q ( c , l [ 1 ] [ 2 ] ) ] , l ) ) , return ( reverse ( l ) ) ) ; |
\[\operatorname{ }\operatorname{F}\left( n,c\right) :=\operatorname{block}\left( l:[[0,0.5]],\operatorname{for} i \operatorname{thru} n \operatorname{do} l:\operatorname{cons}\left( [i,\operatorname{q}\left( c,{{\left( {l_1}\right) }_2}\right) ],l\right) ,\operatorname{return}\left( \operatorname{reverse}(l)\right) \right) \]
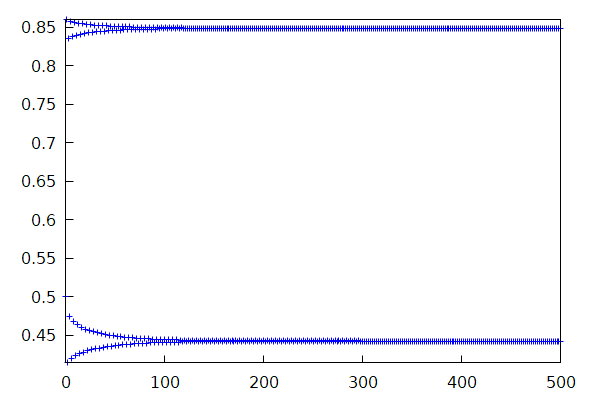
| --> | wxdraw ( gr2d ( points ( F ( 500 , 3 . 44 ) ) ) ) ; |
\[\operatorname{ }\]
\[\operatorname{ }\]
Created with wxMaxima.
The source of this Maxima session can be downloaded here.